This is a super useful function I use all the time, which takes a url as a string and makes a get request, then deserialises the data returned.
let
    getJsonFromUrl = (url as text) =>
        let
            response = Web.Contents(url),
            json = Json.Document(response)
        in
            json
in
    getJsonFromUrl
In this example, we define a custom function called getJsonFromUrl that takes a single parameter called url of type text. We then use the Web.Contents function to make an HTTP GET request to the url parameter, which returns the response as a binary data stream. We then use the Json.Document function to deserialize the response into a structured JSON object.
To use this custom function, simply invoke it with the desired URL as a parameter. For example, to get the JSON data from “https://example.com/api/data“, you would use the following formula in Power Query:
getJsonFromUrl("https://example.com/api/data")
If you need to add authorization headers:
let
    getJsonFromUrlWithAuth = (url as text, token as text) =>
        let
            headers = [#"Authorization"= "Bearer " & token],
            response = Web.Contents(url, [Headers=headers]),
            json = Json.Document(response)
        in
            json
in
    getJsonFromUrlWithAuth
import requests
import json

# Set up API endpoint and access token
endpoint = "https://api.openai.com/v1/chat/completions"
access_token = "YOUR_ACCESS_TOKEN"

# Set up headers for authorization
headers = {
    "Content-Type": "application/json",
    "Authorization": f"Bearer {access_token}"
}


# Define the prompt you want to send to the API
prompt = "Say this is a test!"

# Set up the data to send in the request
data = {
     "model": "gpt-3.5-turbo",
     "messages": [{"role": "user", "content": prompt}],
     "temperature": 0.7

   }

# Send the request to the API and receive the response
response = requests.post(endpoint, headers=headers, data=json.dumps(data))

# Get the generated text from the response
result = json.loads(response.text)["choices"][0]["message"]['content']

# Print the generated text
print(result)
Make sure to replace YOUR_ACCESS_TOKEN with your actual OpenAI API access token. You can obtain an access token by signing up for OpenAI’s API at https://beta.openai.com/signup/. You can also adjust the parameters of the data dictionary to modify the behavior of the API, such as the maximum number of tokens to generate (max_tokens) and the “temperature” of the output.
To get an access token:
Go to the OpenAI website and create an account. If you already have an account, simply log in.
Once you’re logged in, go to the “API” section of the website and select the Chat GPT API.
Choose the plan that best suits your needs. OpenAI offers both a free plan and paid plans with more features and higher usage limits.
After selecting your plan, you’ll be asked to provide some additional information, such as your name, email address, and payment information (if you choose a paid plan).
Once you’ve provided all the necessary information and completed the sign-up process, you’ll be given an access token that you can use to authenticate your requests to the Chat GPT API.
You can then start using the API by making requests using your access token, which will allow you to generate text and engage in conversations with the Chat GPT model.
Note that the process for obtaining an access token may vary slightly depending on the specific plan you choose and any changes to OpenAI’s sign-up process. However, these steps should give you a general idea of what to expect when signing up for the Chat GPT API.
Power Query is a powerful data processing tool that is built into Microsoft Excel and is also available as a standalone product. One of the most useful features of Power Query is the ability to create custom functions in M, the programming language that powers Power Query.
In this article, we will explore how to create a custom function in Power Query M that takes parameters.
What is Power Query M?
Power Query M is a functional programming language used to manipulate and transform data in Power Query. M is used to write formulas, queries, and custom functions in Power Query.
What are Custom Functions in Power Query M?
Custom functions in Power Query M are user-defined functions that can be used to transform data in Power Query. These functions can be reused across multiple queries and workbooks, saving time and effort.
Custom functions in Power Query M can take one or more parameters. Parameters are input values that are passed to the function when it is called.
How to create a Custom Function with Parameters
Creating a custom function in Power Query M that takes parameters is a straightforward process. Here is a step-by-step guide to creating a custom function with parameters:
Step 1: Open the Power Query Editor
The first step is to open the Power Query Editor. This can be done by selecting “Data” from the Excel ribbon, and then selecting “From Table/Range” or “From Other Sources” depending on where the data is located.
Step 2: Create a Blank Query
Once the Power Query Editor is open, create a new blank query by selecting “New Source” and then “Blank Query” from the “Home” tab.
Step 3: Open the Advanced Editor
In the new blank query, select “View” and then “Advanced Editor” from the ribbon. This will open the Advanced Editor window, where you can write your custom function.
Step 4: Define the Function
To create a custom function with parameters, start by defining the function. Here is an example of a simple custom function that takes a text location parameter and uses the free nominatim API: (it even delays the call for 1 second to keep with their rate limits)
let geocode_location = (location as text) =>
        let json_response = Function.InvokeAfter( () => Json.Document(Web.Contents("https://nominatim.openstreetmap.org/search.php?q="""& location &"""&format=jsonv2")),#duration(0,0,0,1))
in geocode_location
Geocoding is the process of converting a text address or location description into geographic coordinates (latitude and longitude). Python provides several libraries for geocoding, including Geopy, Geocoder, and Google Maps Geocoding API. In this article, we will use Geopy and Google Maps Geocoding API to geocode text location data in Python.
Step 1: Installing Geopy
To install Geopy, you can use the following command:
pip install geopy
Step 2: Importing Geopy
To use Geopy, you need to import the geopy library:
from geopy.geocoders import GoogleV3
Step 3: Geocoding text location data using Google Maps Geocoding API
To geocode text location data using Google Maps Geocoding API, you need to have an API key. You can obtain an API key by following the instructions provided in the Google Maps Geocoding API documentation.
from geopy.geocoders import GoogleV3

# Replace YOUR_API_KEY with your actual API key
geolocator = GoogleV3(api_key='YOUR_API_KEY')

location = "1600 Amphitheatre Parkway, Mountain View, CA"

# Geocode location
address, (latitude, longitude) = geolocator.geocode(location)

print("Location: ", address)
print("Latitude: ", latitude)
print("Longitude: ", longitude)
In this example, we used the geocode() method of the GoogleV3 class to geocode the location "1600 Amphitheatre Parkway, Mountain View, CA". The geocode() method returns a tuple containing the address and the latitude and longitude of the location.
Step 4: Geocoding multiple text location data using Google Maps Geocoding API
You can also geocode multiple text location data at once using Google Maps Geocoding API. Here’s an example:
from geopy.geocoders import GoogleV3

# Replace YOUR_API_KEY with your actual API key
geolocator = GoogleV3(api_key='YOUR_API_KEY')

locations = ["1600 Amphitheatre Parkway, Mountain View, CA",
             "1 Infinite Loop, Cupertino, CA",
             "350 Fifth Avenue, New York, NY"]

for location in locations:
    # Geocode location
    address, (latitude, longitude) = geolocator.geocode(location)

    print("Location: ", address)
    print("Latitude: ", latitude)
    print("Longitude: ", longitude)
    print()
In this example, we used a for loop to iterate over the list of locations and geocode each location using the geocode() method of the GoogleV3 class.
These updates include enhancements to data modeling, visualization, and collaboration features. These updates include enhancements to data modeling, visualization, and collaboration features. In this article, we’ll take a closer look at the key features of the March 2023 Power BI updates, along with some examples of how these updates can be used.
Improved data modeling capabilities:
One of the most significant updates in March 2023 is the improved data modeling capabilities in Power BI. With the ability to create and use composite models, users can combine data from multiple sources into a single data model. For example, if you have sales data in one table and customer data in another, you can combine these tables to create a single data model that shows sales by customer.
Another new feature is the support for bidirectional cross-filtering, which enables users to filter data in both directions between tables in a data model. For example, you can use bidirectional cross-filtering to show sales data for a specific customer and also show the customer’s purchase history.
Enhanced visualization features:
Power BI’s visualization capabilities have also been improved with several new features. For example, you can now create custom visuals using the Power BI SDK. This allows developers to create and share custom visualizations that can be used within Power BI reports.
Another new visualization feature is the ability to create drill-through reports. This allows users to navigate to more detailed reports based on a specific data point. For example, if you have a report that shows sales by region, you can create a drill-through report that shows sales by city for a specific region.
Improved collaboration features:
Power BI’s collaboration features have also been enhanced with several new capabilities. For example, you can now create and share templates, which allow users to create standardized report layouts that can be used across different teams and departments.
Another new feature is the ability to annotate and highlight data points within reports. This makes it easier for users to collaborate and share insights. For example, if you have a report that shows sales data, you can annotate a specific data point to highlight a trend or pattern.
Overall, the new March 2023 Power BI updates offer several enhancements to the platform’s data modeling, visualization, and collaboration features. These updates should make it easier for users to work with data and create insightful reports that can be shared with their teams and stakeholders.
The basis of this problem is that there are 100 prisoners. The prisoners are taken to a room with 100 boxes each containing a random prisoners’ ID within them. The (clearly maniacle) prison guards say that:
Each prisoner is to open no more than 50 boxes to find their number
If every prisoner finds the box which contains their number, they are all set free
If even one prisoner fails to find their box, they are all executed
They are allowed to strategise beforehand but must complete the task one-by-one.
So the solution to this problem, is to increase the probability as much as possible that every prisoner will find their number. If every prisoner were to search randomly, the probability is 50% (for each prisoner) and overall it becomes 1/2 * 1/2 * 1/2 .. and so on. Basically, practically impossible.
The solution dictates that each prisoner must start with the box that has their number (ID) on it, and follow the id contained in it to the next box. Since there is a finite system, the numbers contained in the box form a closed cycle (loop) in any n amount. Imagine these boxes as key, value pairs in which the value refers to the direction in a network. For example, if a prisoner opens box 23 and it has id 12 contained within it, he then goes to box 12 and finds id 45 in it, goes to box 45 and finds id 10 in it.. and so forth.
import random
from collections import defaultdict
import networkx as nx
import pandas as pd
import matplotlib
import matplotlib.pyplot as plt

#define prisoners and boxes
prisoners = [*range(1,101,1)]
box_num = [*range(1,101,1)]

#randomly put ID slips in each box
random.shuffle(prisoners)
for box in box_num:
    boxes[box] = prisoners[box -1]
So in setting up the situation we’ve defined prisoners, defined boxes, and randomly shuffled IDs into the 100 boxes.
We want to test the theory that the id, box pairs exist in a closed loop. If we try it a couple of times and graph the output using networkx:
G = nx.DiGraph()
G.add_edges_from(boxes.items())
c = nx.recursive_simple_cycles(G)

nx.draw_networkx(G)
Try 1
You can see for example, prisoner no. 2, following this strategy, would get back to his ID within the requisite 50 tries. Any ID on the larger loop, would not get back to their ID within the maximum tries.
Try 2
Again, the IDs on the right form a loop of less than 50, so anyone following that strategy would eventually find their ID. We also have a loop of 1 for ID 51 in this iteration.
If you think about it, the overall probablity of success is directly linked to the chance that all “loops” are less than 50 long. That way if everyone followed the loop, everyone would be successful. We know that this happens about 30% of the time, so the overall probablity of success is 30%.
So we now want to test out the stragety by simulating each prisoner searching for their
#If we set default to true, and then switch it when a prisoner lands on a cycle longer than 50, it fails everybody.
overall_success = "Success"

#simulating prisoners by checking the length of the loop that they exist on. If it's too long, success = false.
for prisoner in prisoners:
found = False
    for c in cycles:
        if(prisoner in c):
            if(len(c) > 50): overall_success = "Unsuccessful"
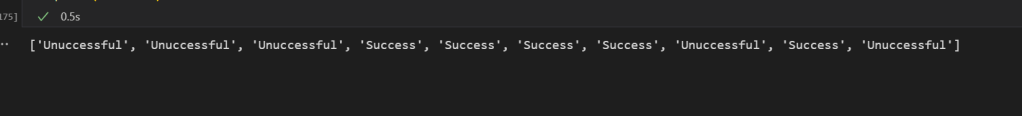
If I run this 10 times, I get a mixture of successful and unsuccessful attempts.
There is 50/50 successful/unsuccessful in there, which isn’t representative of the overall probability. So let’s run it lots of times and see what the overall outcomes come out to.
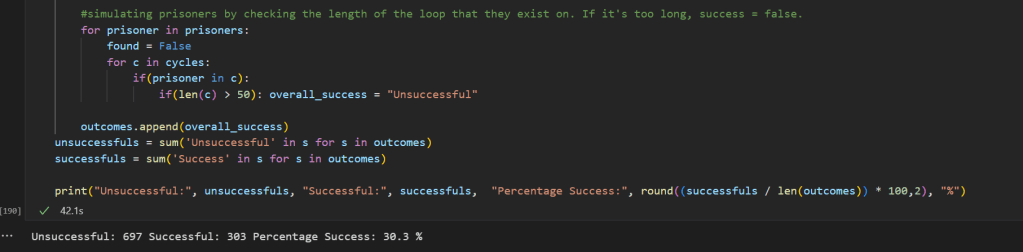
in 1000 tries, 303 succeeded using the loop strategy.
As you can see this is now representative of the probability of success. Full code is below which has the entire block in it:
import random
from collections import defaultdict
import networkx as nx
import pandas as pd
import matplotlib
import matplotlib.pyplot as plt
from collections import Counter


outcomes = []
for i in range(0,1000,1):
    prisoners = [*range(1,101,1)]
    box_num = [*range(1,101,1)]

    boxes = {}

    random.shuffle(prisoners)

    for box in box_num:
        boxes[box] = prisoners[box -1]

    G = nx.DiGraph()
    G.add_edges_from(boxes.items())


    c = nx.recursive_simple_cycles(G)
    #plt.figure(figsize=(20,10))
    #nx.draw_networkx(G)

    cycles = sorted(c)

    #If we set default to true, and then switch it when a prisoner lands on a cycle longer than 50, it fails everybody.
    overall_success = "Success"

    #simulating prisoners by checking the length of the loop that they exist on. If it's too long, success = false.
    for prisoner in prisoners:
        found = False
        for c in cycles:
            if(prisoner in c):
                if(len(c) > 50): overall_success = "Unsuccessful"

    outcomes.append(overall_success)
unsuccessfuls = sum('Unsuccessful' in s for s in outcomes)
successfuls = sum('Success' in s for s in outcomes)

print("Unsuccessful:", unsuccessfuls, "Successful:", successfuls,  "Percentage Success:", round((successfuls / len(outcomes)) * 100,2), "%")
I suspect there are a few people out there, who, like me, have been tasked with the responsibility of appropriately staffing a contact centre. This is a tricky task, and requires a fairly in-depth knowledge of your company’s processes and workflows to start with.
However there is some basic statistics to help you figure out the bare minimum ‘bums on seats’ required to maintain a service level at any given time.
In comes the term “Erlang”, which for those of you who aren’t familiar, is actually a unit of telephony measurement showing full utilization in a given time frame. One person in One hour who spent 60 minutes on a phone call, is 1 Erlang.
There are a few different Erlang equations, notably Erlang A, B, and C however we’re only really concerned with the C calculations since the other two are meant for something else. Don’t ask me what.
from callcentrehelper.com
Today we want to flip it around, so we’re computing for N (the number of required agents) since we know what service level we’d like to achieve.
Imagine we have a dbo.HourlyPerformance table that looks something like this: CREATE TABLE dbo.HourlyPerformance ( id int not null IDENTITY(1,1), datekey int not null, hourkey int not null, TotalCalls int null, AvgHandleTime float null, ServiceLevel float null, HoursWorked int null) Where we needed to know when our periods of under and overstaffing have been historically, or for basic regressive analyses (i.e., forecasting). We want to be able to compare in any given hour, how many more people it would have taken to get the service level ideally using SQL as my language of choice.
SET ANSI_NULLS ON
GO
SET QUOTED_IDENTIFIER ON
GO
CREATE FUNCTION [dbo].[PowerFactorial] ( @m float,  @u float)
RETURNS float
AS
BEGIN
Declare @counter float --counter
Declare @total float -- return value
SET @counter = 1 SET @total = 0 WHILE @counter <= @u BEGIN SET @total = @total + Log(@m/@counter) Set @counter= @counter + 1 END RETURN Exp(@total) END GO SET ANSI_NULLS ON GO SET QUOTED_IDENTIFIER ON GO -- ============================================= -- Author: David tigue -- Create date: 4/12/2013 -- Description: ErlangC -- ============================================= CREATE FUNCTION [dbo].[ErlangC] ( -- Add the parameters for the function here @m float -- Number of Agents ,@u float -- Traffic intensity ) RETURNS float AS BEGIN --Source http://www.mitan.co.uk/erlang/elgcmath.htm Number 6 -- Return Variable DECLARE @Prob Float -- Probability of Call not being answered immediately and having to wait. -- Variables Declare @Numerator Float -- Top of Equation Declare @Denominator Float -- Bottom of Equation Declare @Summation float -- Summation part of Denominator Declare @k float -- increment for summation --Calculate Numerator SET @Numerator = dbo.PowerFactorial(@u,@m) -- Start Summation with k starting at 0. SET @k = 0 SET @Summation = 0 While @k < @m-1 Begin SET @Summation = @Summation + dbo.PowerFactorial(@u,@k) SET @k = @k +1 End --Calculate denominator SET @Denominator = dbo.PowerFactorial(@u,@m) + (1-@u/@m)*@Summation SET @Prob = @Numerator/@Denominator -- Return the result of the function RETURN @Prob END GO SET ANSI_NULLS ON GO SET QUOTED_IDENTIFIER ON GO -- ============================================= -- Author: David Tigue -- Create date: 04/15/2013 -- Description: Erlang C Service -- ============================================= CREATE FUNCTION [dbo].[ErlangCServ] ( -- Add the parameters for the function here @m int -- Number of Agents ,@u float -- Traffic Intensity ,@t float -- Target Time ,@ts float -- Average Call Duration ) RETURNS float AS BEGIN -- Return the result of the function RETURN 1 - dbo.ErlangC(@m, @u) * Exp(-(@m - @u) * (@t / @ts)) END GO SET ANSI_NULLS ON GO SET QUOTED_IDENTIFIER ON GO -- ============================================= -- Author: David Tigue -- Create date: 04/15/2013 -- Description: Erlang C Service -- ============================================= CREATE FUNCTION [dbo].[ASA] ( -- Add the parameters for the function here @m int -- Number of Agents ,@u float -- Traffic Intensity ,@ts float -- Average Call Duration ) RETURNS float AS BEGIN -- Return the result of the function RETURN dbo.ErlangC(@m, @u) * @ts / (@m - @u) END GO SET ANSI_NULLS ON GO SET QUOTED_IDENTIFIER ON GO -- ============================================= -- Author: David Tigue -- Create date: 4/15/2013 -- Description: Calc Number of People Required for given Service Level -- ============================================= CREATE FUNCTION [dbo].[ErlangCRequired] ( -- Add the parameters for the function here @A float -- Average Arrival Rate (second) ,@ts float -- Average Call Duration (seconds) ,@t int -- Time Goal ,@svl float -- Service Level Goal ) RETURNS float AS BEGIN DECLARE @u float -- Traffic Intensity Set @u = @A * @ts DECLARE @m float --number of agents SET @m = 2 WHILE dbo.ErlangCServ(@m,@u,@t,@ts) <= @svl Begin SET @m = @m + 1 END -- Return the result of the function RETURN @m
END
GO
Notice the very last function [dbo].[ErlangCRequired] does something interesting, essentially it loops through the ErlangCServ until it gets to the minimum required agents that produce the requisite service level. Funnily enough, it is fairly performant and doesn’t take a hit when processing hundreds of thousands of rows.
So we can now update our table using this, or just use the scalar function to get required agents in an hour. SELECT datekey, hourkey, totalCalls, AvgHandleTime, CASE WHEN totalcalls >0 AND avgHandleTime > 0 THEN dbo.ErlangCRequired(TotalCalls / 3600.00, AvgHandleTime * 60, 20,.80) ELSE NULL END 'agentsReqd' FROM HourlyPerformance
You can then visually establish where your peaks and troughs are, if you set it up in some ETL or something, regularly.